The Data-driven
eCommerce Workbook
The Data-driven
eCommerce Workbook
A process for designing solutions based on insights from customer behavior.
Get the FREE Google Slides workbook
Get the FREE Google Slides workbook
Make a copy, print it out, make it your own.
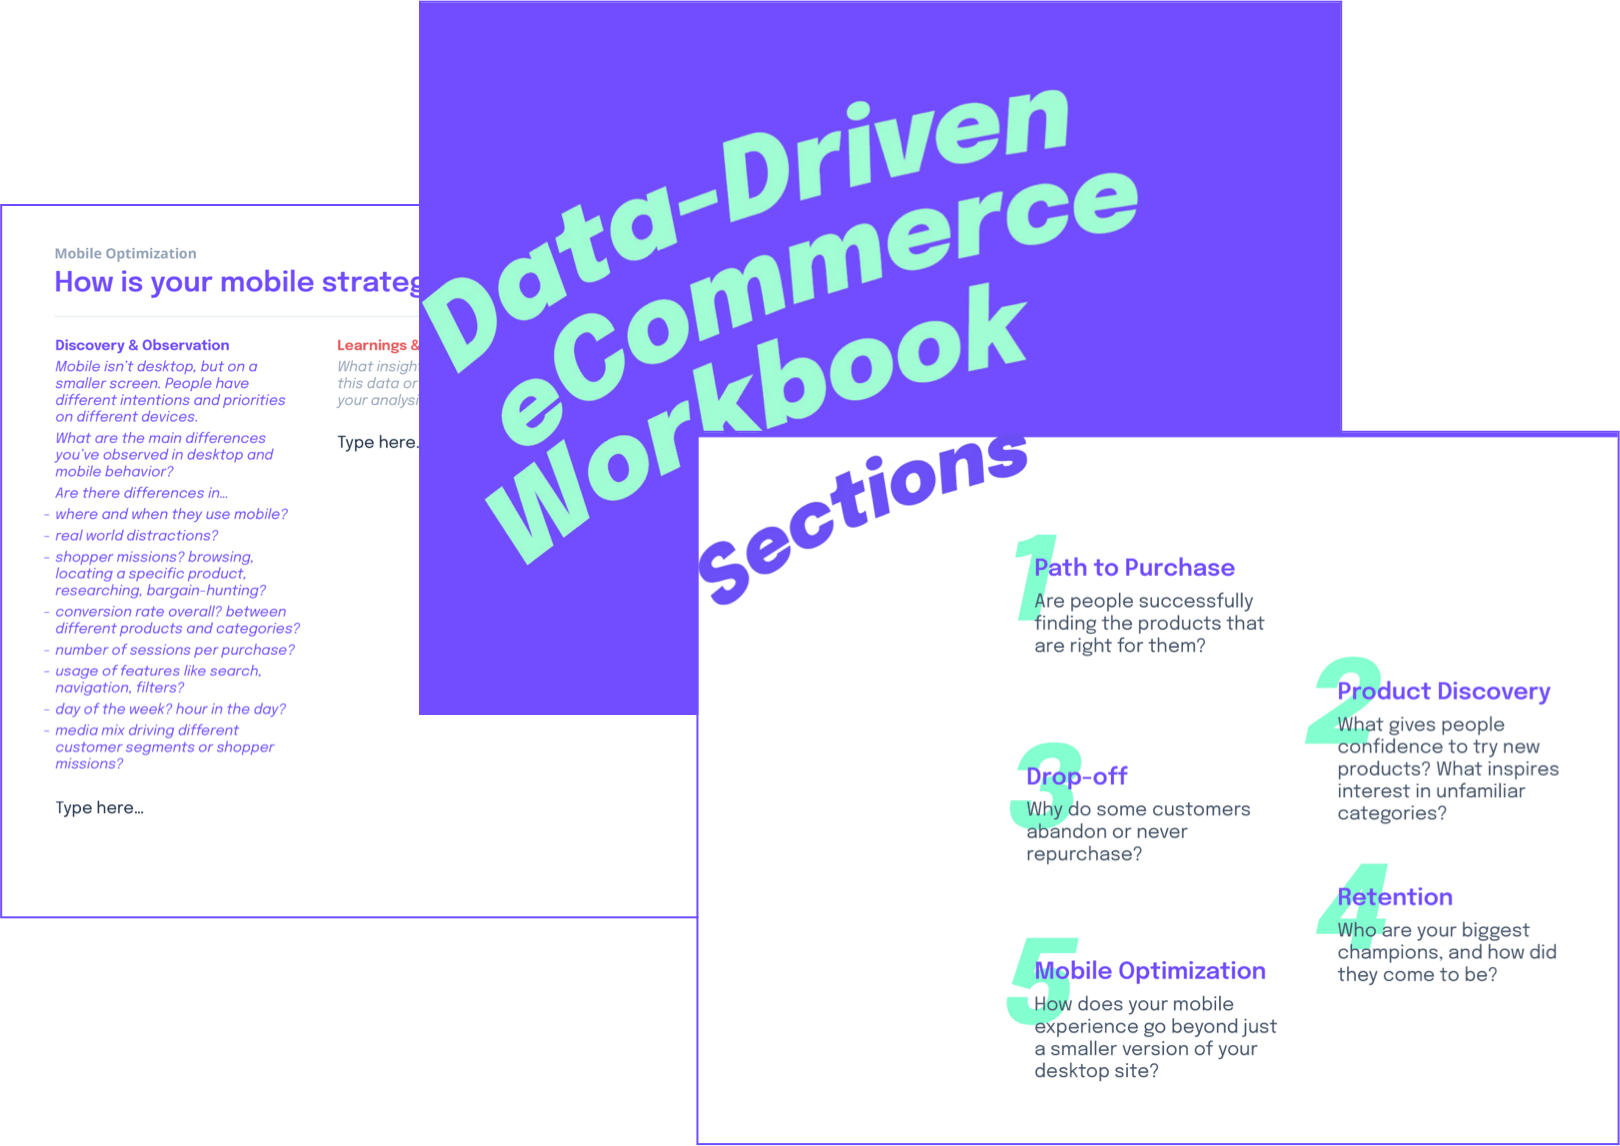
Identify, analyze, and design solutions for all aspects of your eCommerce site experience from Path to Purchase, Product Discovery, Drop-off, Retention, and Mobile Optimization.
Make a copy, print it out, make it your own.
Identify, analyze, and design solutions for all aspects of your eCommerce site experience from Path to Purchase, Product Discovery, Drop-off, Retention, and Mobile Optimization.

Take a pulse check on your entire site's experience
The workbook is divided into 5 sections, casting a wide net to cover areas inherent to most eCommerce businesses. Taking a week to go through the entire workbook can help the team take a step back and recalibrate, zoom out on the holistic experience, then zoom in to the areas that need the most attention. This can result in:
- a series of low effort, high impact quick wins with both problem and solution to test identified
- gaining insight on areas that need the most attention for further improvement
- turning unknown unknowns into known unknowns for further research
Go deep on a specific area
You might already know that the navigation is confusing, or that retention is dropping. Jump directly to each relevant section.
For confusing navigation, jump to Path to Purchase.
- How are people using the navigation today for each different shopping mission? Is there a difference between how return and new users browse and engage with the different forms of navigation?
- How does using search compare with using the navigation?
- What % of revenue and conversions does search influence compared to interaction with the nav?
- What types of products are found via search, compared to using the navigation?
- What types of hacks are people employing to find what they're looking for?
Are there products that aren't catching on? Is your retention strong, but have difficulty getting the first-time customer to Discover?
- What brings new people to your site? What are the top unbranded search queries?
- What products or categories are most-often removed from cart? Why do you think that is?
- In the customer lifecycle, from unaware > aware > consider > buy > enjoy, where do you succeed and where is there room for improvement?
- Where are there opportunities where people can either upgrade or complement their purchase? An upgrade is to purchase a more premium product instead. A complement is to purchase additional products that enriches the experience of their main purchase.
Issues with Drop-off or Retention?
- Have you identified your most valuable customers?
- What do they have in common? Were they acquired in the same way? Is their customer journey similar?
- What are your main customer segments? What is the current purchase frequency of each segment?
- What tactics have been effective in driving repurchase or re-engagement? Are there any unintended consequences to these tactics?
- What motivates your customers intrinsically & extrinsically? Do different groups of people feel motivation in different ways? Are the ways you're rewarding customers aligning with your customers' motivations?
Noticing spikes in mobile traffic, especially from social marketing campaigns, and not sure if your Mobile strategy is prioritized?
- What are the main differences you’ve observed in desktop and mobile behavior? Are there differences in…
- where and when they use mobile?
- real world distractions?
- shopper missions? browsing, locating a specific product, researching, bargain-hunting?
- conversion rate overall? between different products and categories?
- number of sessions per purchase?
- usage of features like search, navigation, filters?
- day of the week? hour in the day?
- media mix driving different customer segments or shopper missions?
When you're feeling stuck, overwhelmed, or not sure where to start
We all have our own standard operating procedures for approaching our work —— a comfortable routine that we've settled into because it has served us well. If you find yourself stuck, the question-based prompts could help lend a fresh perspective to help you attack the problem or approach the analysis from a different angle.
It's also a way to help add structure when looking through your analytics tool, customer recordings, or piles of customer interview notes. If you find yourself getting overwhelmed because there's so much data everywhere that nothing feels actionable, having a goal in mind can help you drill in to just the areas that matter, and avoid the time drain of going down distracting rabbit holes.
To steer product decisions away from personal preferences and back on the user
I've also used this workbook as a workshop tool to help align stakeholders who all may have different ideas for what to build or ideas that need help unpacking. "The breadcrumbs should be bigger!" "Everyone's doing personalization —— we need it too." "The navigation is messy —— let's clean it up."
There's potential merit in all of these ideas, but what is the problem that each of these is addressing? Is the problem worth addressing? How is the problem currently affecting customers? Based on that, is this the best solution?
As an example, one executive felt strongly that their site needed bigger, better breadcrumbs on product detail pages (PDPs). It's an eCommerce best practice they've read in several articles, and when they use the site themselves, they find themselves using the breadcrumbs to navigate. The team had mixed feelings about this request and asked for my thoughts. Looking at heatmaps of the site usage, it was clear that customers were in fact using breadcrumbs to navigate —— in fact, clicks on the breadcrumbs exceeded clicks on the main navigation on product detail pages. But, the footer was also getting a large percentage of clicks. Based on these observations, we could conclude that since breadcrumbs are used so often that we should invest in bigger, better breadcrumbs. Another interpretation is that the rest of the navigation is failing the user that they're resorting to breadcrumbs and the footer to continue their journey or complete their shopper mission. Drop-off was also highest on Product Detail Pages (PDPs), and people landing on a PDP had the lowest engagement (page views per session and session duration) of any page type. Are breadcrumbs the best way to improve PDPs to make them more engaging and to help cross-navigation to the right products or categories?
By unpacking an idea back to the problem, then rooting it in objective observations of what's actually happening, teams can lead productive discussions on how to interpret what they saw, then brainstorm solutions based on that shared understanding of the problem. This helps avoid the trap of starting with a solution, then data-mining your way to justify it, or loss of morale when one hunch overrules another hunch.

Each prompt is broken into three sections to help guide your analysis from the objective data observed, your interpretation of the data and insight, and finally your proposed solution to test.
ONE
Discovery & observations
What data did you analyze and what behavior did you observe?
This is the quantitative or qualitative evidence for each prompt. This might be a snapshot of a Google Analytics report, quotes from a customer interview, observations or recording of a customer using the site, a graph, data table, or any other observable evidence.
TWO
Interpretation & insights
What’s your interpretation of this behavior? What insights can you extract?
This is the qualitative analysis. Why might the data present in this way?
Stretch your thinking in how you interpret these observations—for example, observing many footer navigation clicks might mean bigger, better footer nav! Or, it could be a consequence of the overall navigation being so challenging that people are resorting to the footer nav.
THREE
Decisions & Actions
What are your proposed next steps, changes, or tests from these learnings?
Based on the data observed and analysis, what are the resulting action items?
This may include brainstorming solutions, running tests to confirm that the interpretation of the data is correct, or further studies to be done.

1 Path to Purchase
Especially for conversion rate optimization, we like to look for high-impact opportunities fitting these three criteria:
- High traffic / engagement areas so that even a small lift would yield meaningful results.
- High revenue areas where even a small lift in traffic / engagement would yield meaningful results.
- A valuable learning, such as validating a dangerous assumption.
In this case, 20% of revenue was influenced by interaction with filters, which only 5% of sessions used. If filters are helpful in narrowing the inventory to help people browse for the right products, why aren't more people using filters? Could we make filters more accessible and useful? What else does this tell us about how our customers are shopping?
ONE
Discovery & observations
- 5% of sessions interact with filters, but influences 20% of revenue.
- Evidence of shoppers going back and forth in this pattern: List page → product → list page.
- More customers use filters on desktop than on mobile, but both cases show a major impact on average time on site.
- Filters seem to matter more than average for [product category A], which is 24% of revenue. 30% of filter clicks happen on this product category's list page.
- Half of all filter clicks are for "use method" even though “trending” filters are the default application and appear in the top position of the dropdown.
TWO
Interpretation & Insights
- Filters are helping customers get to the right product, but are being used by a small percentage of customers.
- Customers are using filters on [product category A] as a guardrail (as opposed to exploration tool) based on the high usage of "use method" to narrow results.
- Back and forth may indicate people browsing—not necessarily not finding what they need, but not being able to decide or looking for inspiration to strike. Browsing isn’t necessarily a behavior to “solve”, but making a decision and reducing browse friction might be.
THREE
Decisions & actions
- Consider thinking about filters in two use cases: Guardrails and Exploration.
Guardrails help limit results to products the customer can use based on their situation, and filter out incompatible products.
Exploration helps customers explore the range—such as to filter by styles and colors. - At the time, filters were by default all collapsed. Try testing if opening all filters by default can help make them more accessible, and increase usage to help people narrow the wide assortment.
2 Product Discovery
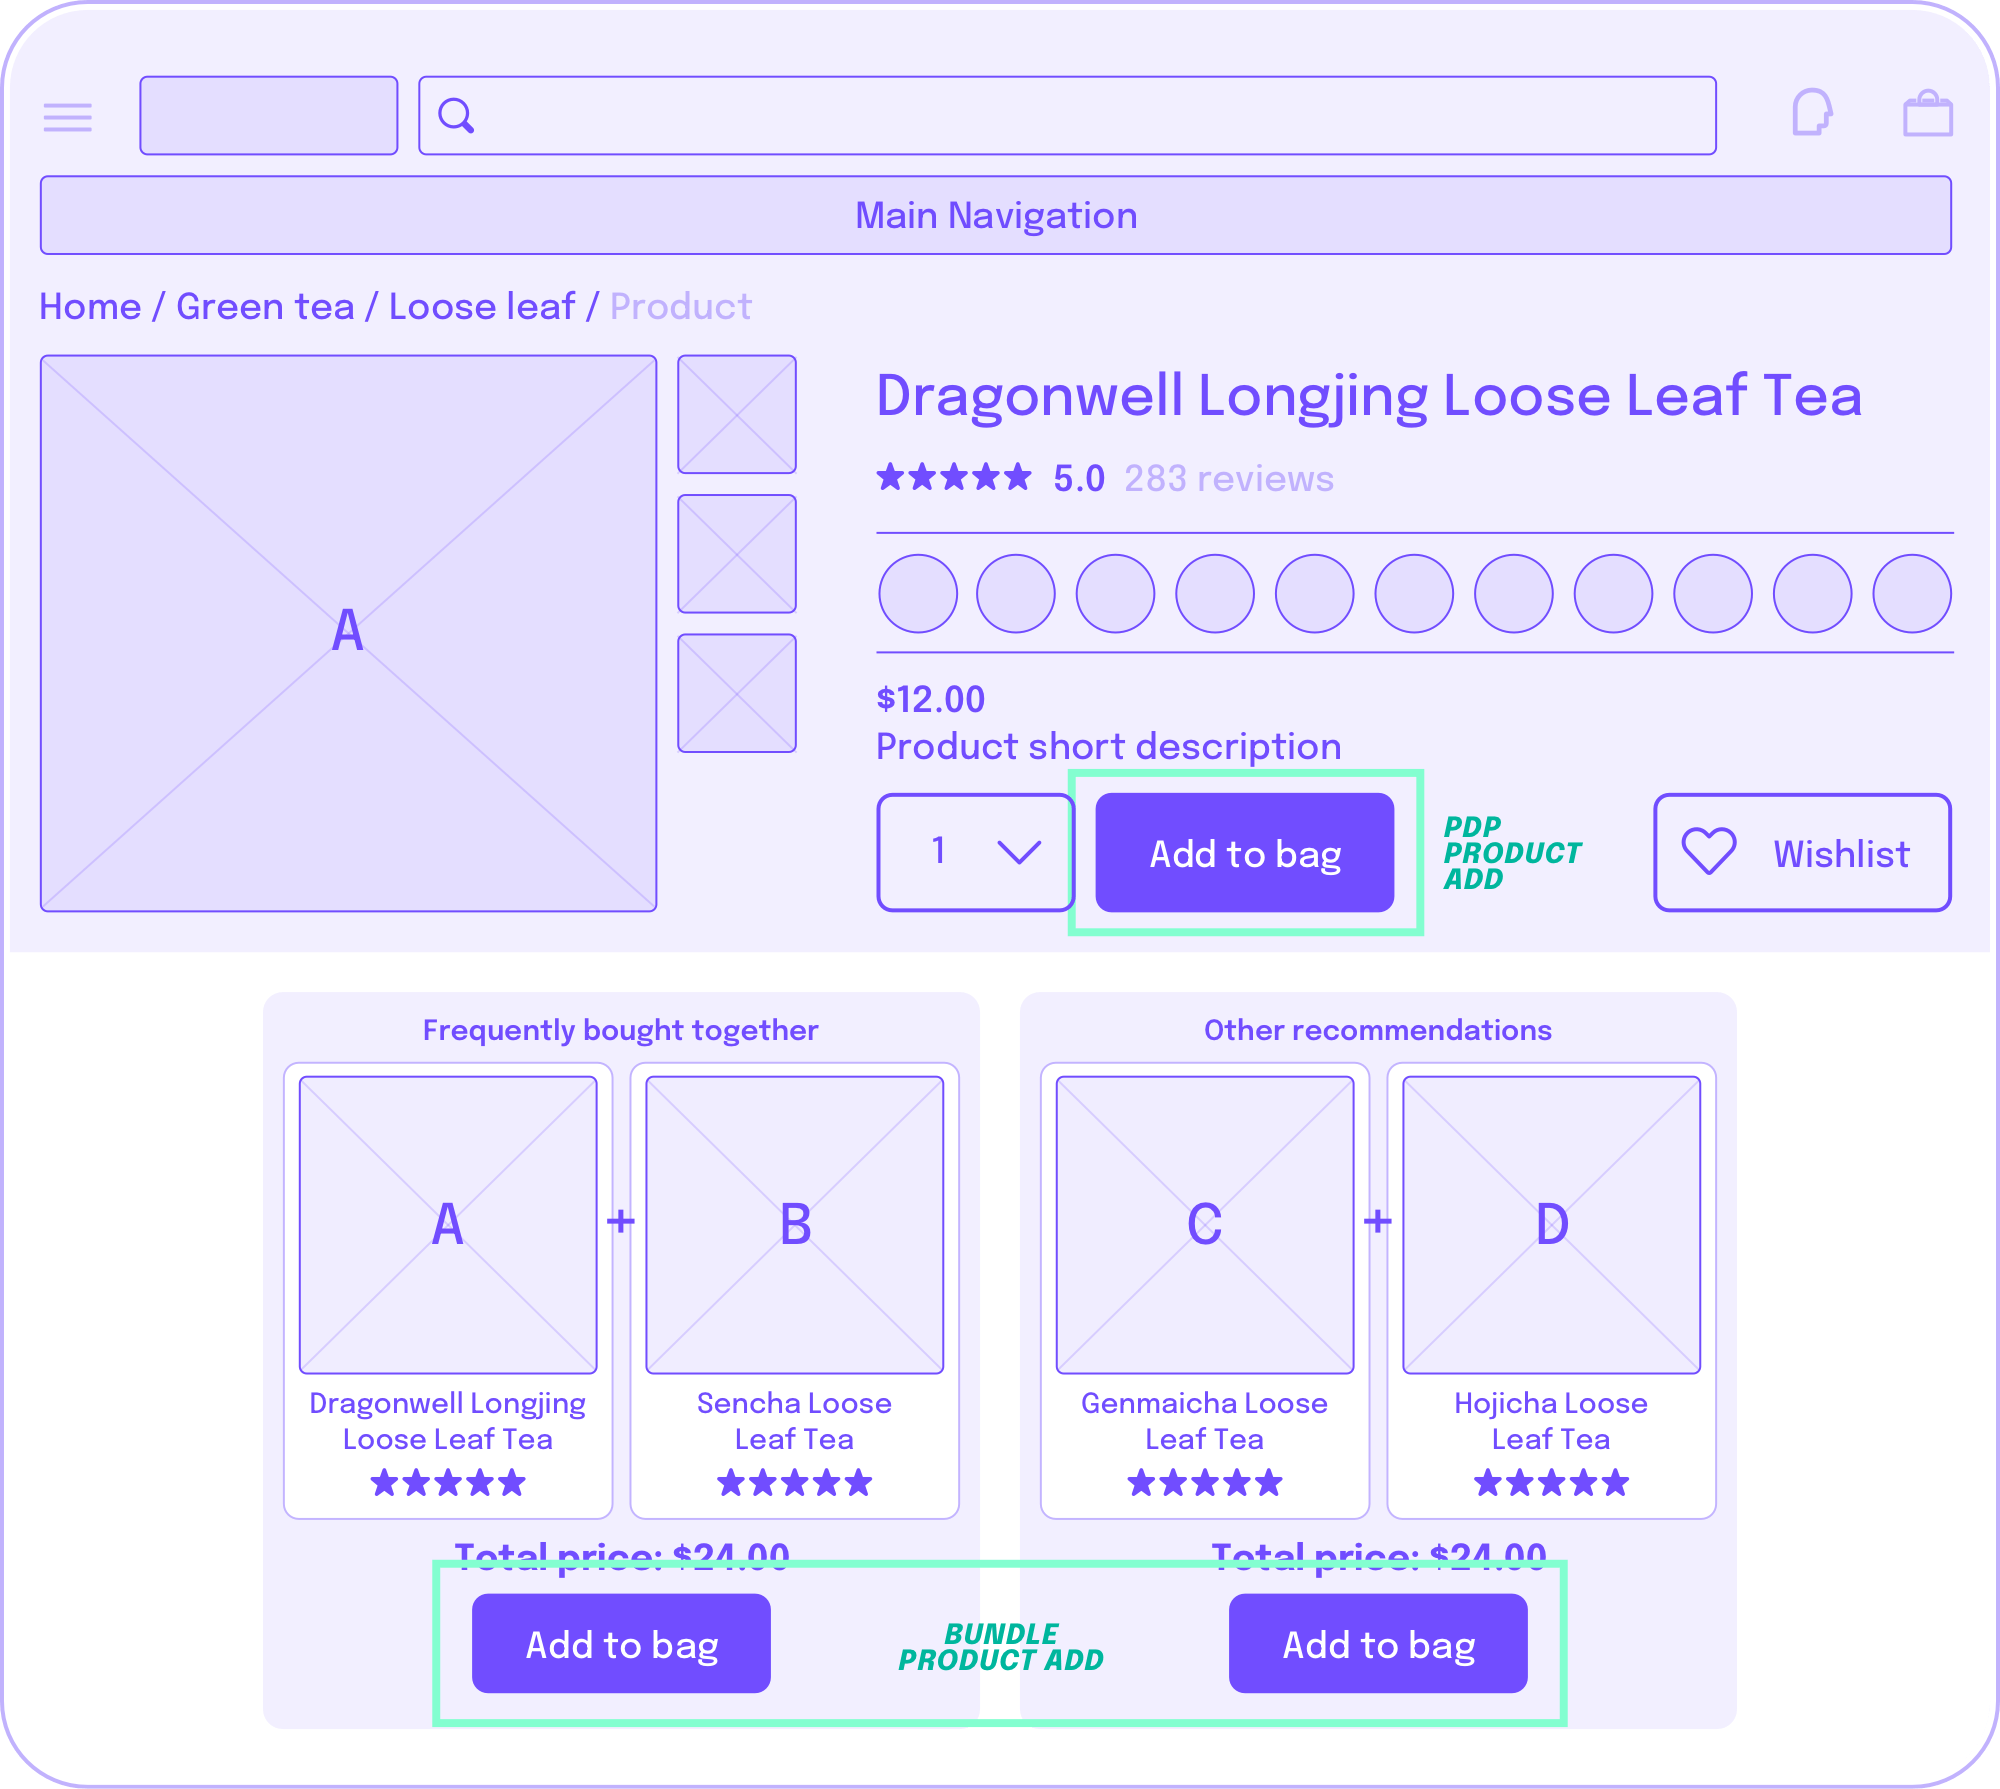
One client's niche product assortment was successful in driving organic traffic to their product detail pages (PDPs). However, PDPs were the worst-performing page type (compared to the homepage and product list pages)—failing to engage traffic in page views per session and session duration. In an effort to help shoppers discover other products offered and increase engagement, a recommendations widget was added to all PDPs that paired similar products together and exposed more options for the shopper to continue their journey. How did this perform and what can we learn?
ONE
Discovery & observations
- 36% of all add-to-cart events were using the “Bundle Product” widget on Product Detail Pages (PDP), 32% were Product List Page (PLP) adds, and 31% were PDP primary product adds.
- Relative eCommerce conversion rates for each type of add-to-cart event:
TWO
Interpretation & Insights
- Although bundled products account for the most add to cart items, only a small amount of users engage with the bundle tool and overall show low relative conversion rates.
- Users who add bundled products may be adding to cart for other reasons than intent to purchase.

THREE
Decisions & actions
Understand why
Are customers adding bundles because they misunderstand or assume thereʼs a bundle discount? Then remove when they realize thereʼs no additional benefit to the bundle in their cart?
Improve cross-navigation
An important function the PDP must serve is to enable shoppers to cross-navigate to similar products and the parent product category (browse while remaining close to the target product).
Instead of constraining shoppers to 3 select products (which likely arenʼt a perfect match), consider adding links to the brand, product category, styles, properties, and other parent categories.
Improve cross-sells
By simplifying decisions
Consider testing a bundle that shows the PDP product + a set of matching glassware of the same brand. This removes the additional complexity of deciding if the unit price on the beer + glassware set is a fair value.
By separating alternative & supplementary
Consider separating alternative and supplementary products in this cross-sell section, since it caters to two distinct and opposite use cases.
Alternative: products that replace the main product (similar configuration, different brand).
Supplementary: complements or improves the experience of the main product (merchandise, accessories).
3 Drop-off
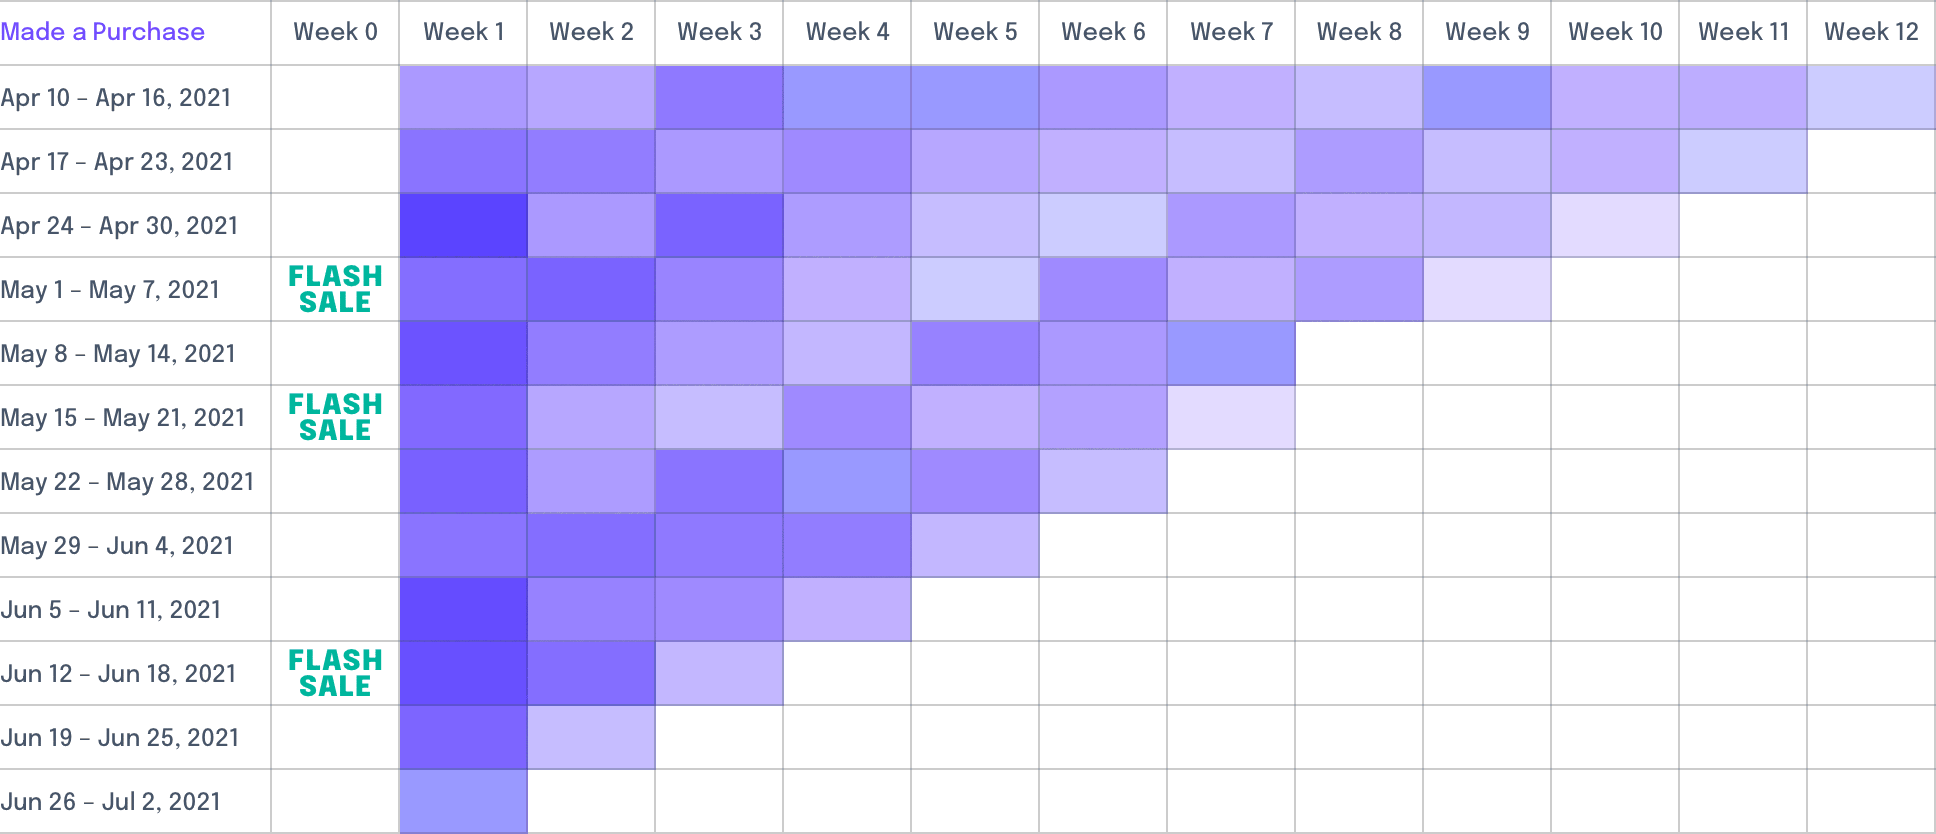
It's (almost) always more expensive to attract a new customer than it is to retain an existing one. Customer interviews and surveys can be some of the most insightful ways to understand why some people become loyal customers and advocates, while others bounce and churn. But to take a quicker, broader view at your business, running a cohort analysis can reveal patterns that you can further probe in your customer research. In this example, we discovered customer habits that are statistically significant across time that can't be dismissed as anecdotal evidence.
ONE
Discovery & observations
- Week over week transaction 12-week drop off. Return rate is correlated with promotional days with a steady decline in return rate for cohorts acquired in earlier periods.
TWO
Interpretation & Insights
- Sales are reactivating purchase behavior of past cohorts.
- Previously acquired cohorts are being trained to purchase only on promotional days. There is a high return rate on promotional days for customers recently acquired, but the rate decreases steadily for relatively earlier cohorts.
THREE
Decisions & actions
Use sale events to strategically reactivate customer segments
Week 7 shows a steep drop-off in re-engagement with sale messaging. Consider messaging dormant customers differently than newly-acquired customers. Perhaps the price discount announcement alone isn’t enough to trigger purchase for an older or dormant cohort.
Reward and encourage loyalty
How could sales events be even more effective at reactivating existing customers and building loyalty? Early access for the best selection? Newsletter-only product discounts? Sneak peek at Cyber Monday selection? Contests?
Post-sale workflow
Beyond monitoring the effectiveness of sales events to attract new customers, monitor its impact on retaining existing customers.
4 Retention
One client sells specialty hobby starter kits and refills. It's a trendy hobby to take up, but requires hours of dedication to get started—and you're not guaranteed that your first try is successful. It was also unclear to the team if these kits were actually being used, or if they were purchased aspirationally and spent their lives gathering dust in the garage.
ONE
Discovery & observations
- Customers clustered into 5 distinct attitudinal segments:
- The Holiday Gifter
- The Beginner (largest segment)
- The Refiller
- The Discount Hunter (highest order value)
- The Expert (highest lifetime value)
- Based on survey responses:
For The Beginner and The Holiday Gifters, many kits remained unused.
The Holiday Gifter can be one of many different demographic groups, whereas The Expert tends to be homogeneous.
TWO
Interpretation & Insights
- Although The Experts had the highest lifetime value, focusing attention on them is diminishing returns.
- Even if we improve retention of The Beginner by a small percentage, the incremental annual revenue would be significant.
- Assumption: If we can provide the urgency to try the kit and provide a good first-time experience, we might be able to retain more Beginners and gift recipients.
- Assumption: If we can provide a better sense of progression through this hobby in a fun, achievable way, we can step more customers through the journey to become Experts.
Context mapping: potential solutions to unmet needs
THREE
Decisions & actions
Identify customer-centric solutions
Conduct interviews to understand the customer's unmet needs, pain points, barriers, concerns at each stage of the customer journey.
Hypothesize solutions to help address each unmet need
For each unmet need at each stage, brainstorm possible solutions to address the need. This could include looking to your existing channels (including offline resources if you have them) and analogies with other markets/problems (how have others addressed a comparable problem?).
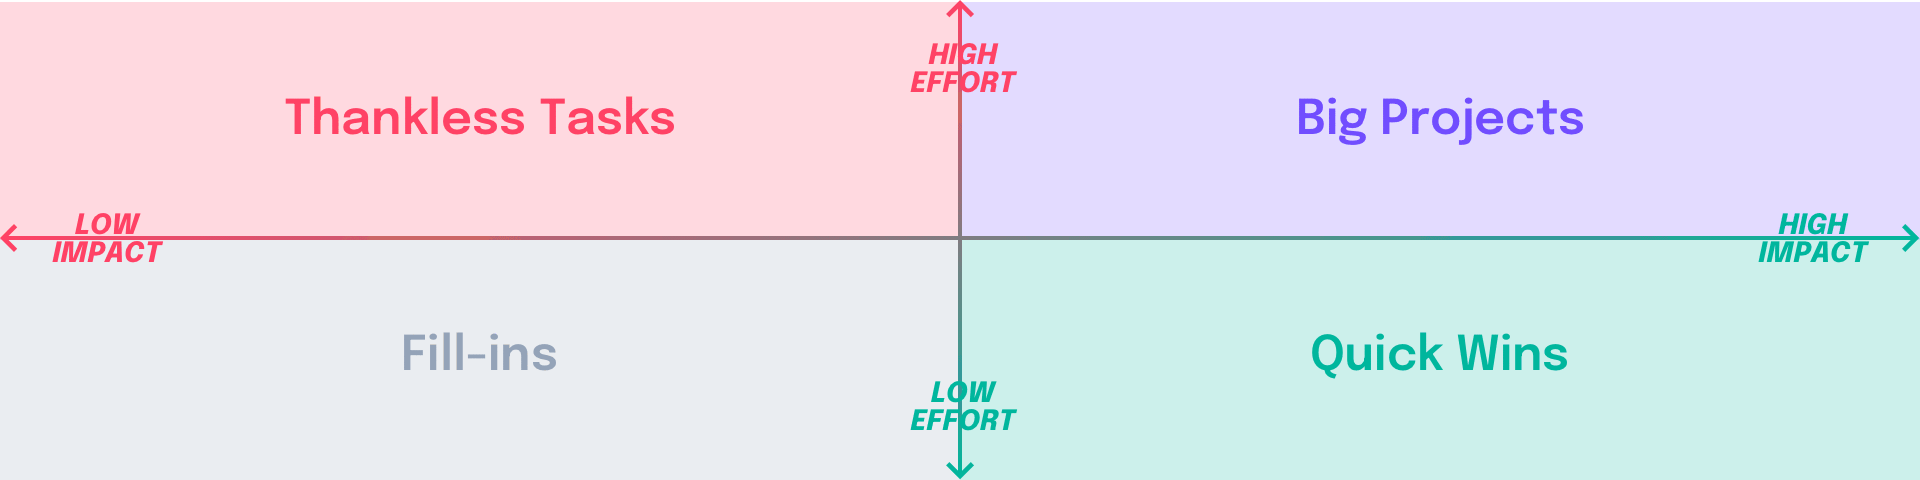
Prioritize solutions
Which of these needs are most painful? Which ones are we best positioned to solve? Which assumptions can we validate cheaply and quickly? One way to quickly evaluate the long list of ideas generated in the previous step is to categorize solutions by their execution effort and impact. [Based on the Action Priority Matrix]
5 Mobile Optimization
5 Mobile Optimization
Okay first, why is mobile even a category on its own? Doesn't it make this whole thing not MECE (mutually exclusive, collectively exhaustive)? I get it, but as long as there's a bias toward desktop experience first, it's worth emphasizing that mobile isn't desktop, but smaller. With differences in distractions, times of day, physical locations, marketing mix, patience level, mobile behavior can sometimes be surprisingly different from desktop and can be optimized differently.
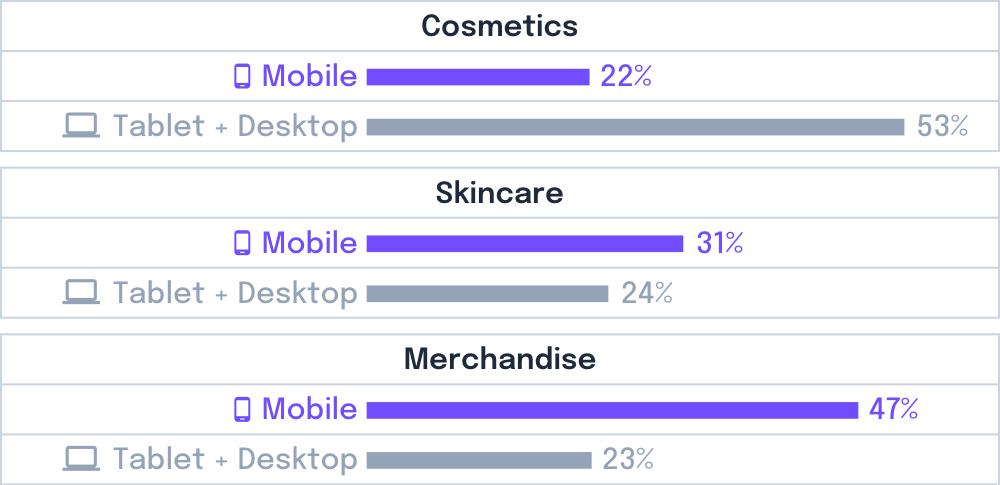
For example, one client I was working with had entirely different shopping behavior on mobile:
ONE
Discovery & observations
- Top-purchased mobile product category is Merchandise (representing 44% of quantity sold).
TWO
Interpretation & Insights
- Is cosmetics the least-popular mobile purchase category because there are too many options?
- Are mobile users less likely to browse and purchase under the cosmetics category because there are not enough filter and sort options to help them make sense of the large assortment?
THREE
Decisions & actions
- Test UX improvements to navigation information architecture, filtering, sorting, and cross-navigation to help narrow selection.
- Test additional signals to aid decision-making on both a UX, assortment, and policy-level. Add social proof, clarify the value prop of each product, consider bundling products to simplify decisions and automatically reach free-ship minimum, and emphasize free returns and free shipping minimum to boost confidence.
- Consider focusing marketing campaigns that target mobile devices on products that donʼt require complex decision-making, comparison-shopping, or exploration.
Get the FREE Google Slides workbook
Get the FREE Google Slides workbook
Make a copy, print it out, make it your own.
Identify, analyze, and design solutions for all aspects of your eCommerce site experience from Path to Purchase, Product Discovery, Drop-off, Retention, and Mobile Optimization.
Make a copy, print it out, make it your own.
Identify, analyze, and design solutions for all aspects of your eCommerce site experience from Path to Purchase, Product Discovery, Drop-off, Retention, and Mobile Optimization.
Credits
Thank you to my analytics partner Lea Masatsugu, who taught me everything I know about approaching analytics in a thoughtful way. Also thank you Dana Lee, who worked with me to stress test this approach and format. And finally, thank you Brandon Tadesse, for all of the feedback along the way.